Computing
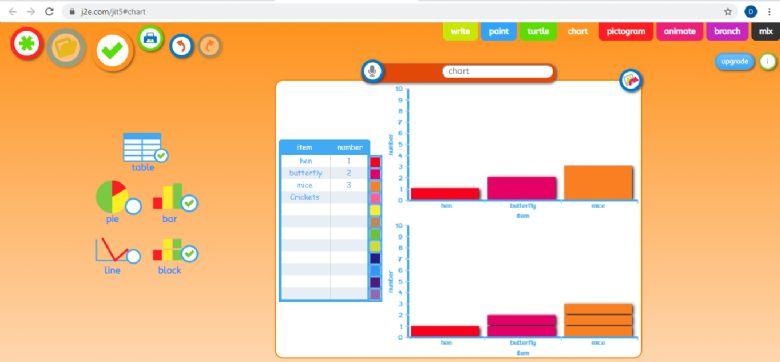
This week we are continuing learning about using the computer to create charts of data using the website
j2e.com
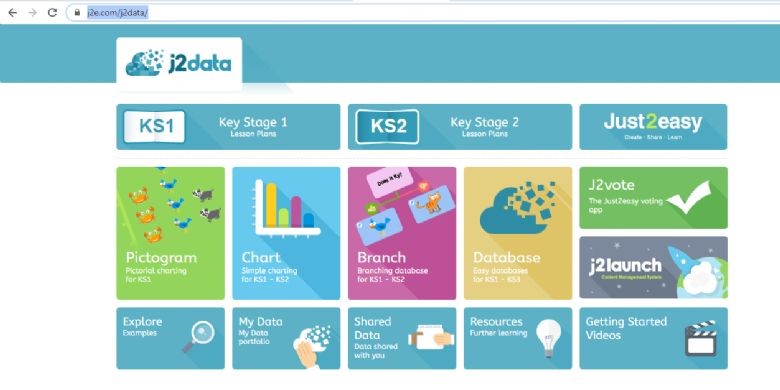
Click on the link - https://www.j2e.com/j2data/
Read the story Handa’s Hen using the power point below. As you read the story make notes of the animals and how many of each type there are in the story.
Use the chart to make a table, block chart or bar graph of the number of animals from the story.